Motivation
Primary goals
According to WHO, the United States has the highest level of illegal drug use compared with other countries in 2019. The two most commonly used illicit drugs are marijuana and opioids. Overall drug use was also reported to be on the rise. The NSDUH survey in 2019 indicated that 20.8% of people aged 12 and over had illicit drug use, which is a notable increase from 2015 (Buddy, T. 2021) . Illegal drug abuse is more important to be prevented among the youth, since drugs are more harmful to them, such as affecting the growth of brains, impairing memories and concentration. Thus, we would like to study the drug use abuse among youth to detect some patterns, which would be useful for policymakers to develop strategies with explicit targets, and thus achieve the most effective results.
Secondary goals
Our next step was to examine which patterns are important for the policymakers to make problem-oriented strategies. The most conspicuous one is the drug use by the state. We also expect finding the patterns of different drug use to be helpful, such as average age, race, and gender of illegal drug use by the drug. Moreover, we learned an example of a case-control study from the Epidemiology course illustrating that drug use might be associated with other behaviors affecting personal health, so we would also develop our study to explore patterns in this area.
Conclusion and Discussion
Drug use overview
- In the over-view plot we found that the drug use proportion varies hugely among states and states. And it seems no geographical relationship between drug use proportion and states. Light drug use distribution and heavy drug use distribution do have a strong relationship.
- Arizona State has the most proportion of taking drugs both in the heavy dose and light dose which is 0.249789 and 0.3140928, on the contrary, UT state has the least proportion of people who take drugs, the proportion of students who haven’t taken drug yet is 0.7596792.
- Marijuana is the most popular drug overall drugs and the number of marijuana users is even more than the sum of other drugs users.
- Top 3 popular drugs are marijuana, inhale and ecstasy.
Drug proportion in each race
- Marijuana use in each race doesn’t have a big difference, however, white people tend to have less proportion of having ecstasy and inhaling drugs than other races.
Drug use in different age
- Of all the light dose drug users, females have a greater proportion than males. On the other hand, of all the heavy-dose drug users, males have a greater proportion than females. This means males have a higher chance than females to transfer into heavy-dose drug users.
Marijuana and Other Drug Use Proportion
Marijuana is the most abused drug. Most of the states has the overall drug use proportion greater than 50%. We found that Arizona has the largest proportion of marijuana use among the youth. Arizona also has the highest other drug use proportion of 32%. We could also found in the plot that the states having high proportion of marijuana use are those in which marijuana use is legal, whereas the states which make it illegal have low rate of marijuana such as Utah, Iowa, and Nebraska.
Marijuana Start Age
Although the mean starting age are relatively similar for each state, we found that Arizona still has the youngest starting age, which means that Arizona has severe problem of marijuana abuse not only for the proportion, but also for the starting age. Moreover, by comparing the plot of light dose and heavy dose, we discover that people who have heavy dose generally start to use marijuana earlier than those who have light dose.
Based on the statistical analysis and visualization in Data Analysis, we have some important findings:
Bi-level Risky Behaviors
There are strong associations between overall drug use status and behaviors that are extremely dangerous, such as driving or riding car with drunk driver, carrying weapons, attempt to suicide, physical fights, among high school students. Some of behaviors could result in irreversible fatal outcomes, so these findings should raise school’s attention on the reasons behind this correlation and came up with some methods resolve the issues. Moreover, the proportion of behaviors that could harm the long-term health condition of students, such as sexual activity and short sleep time, is higher among students who used drug more frequently.
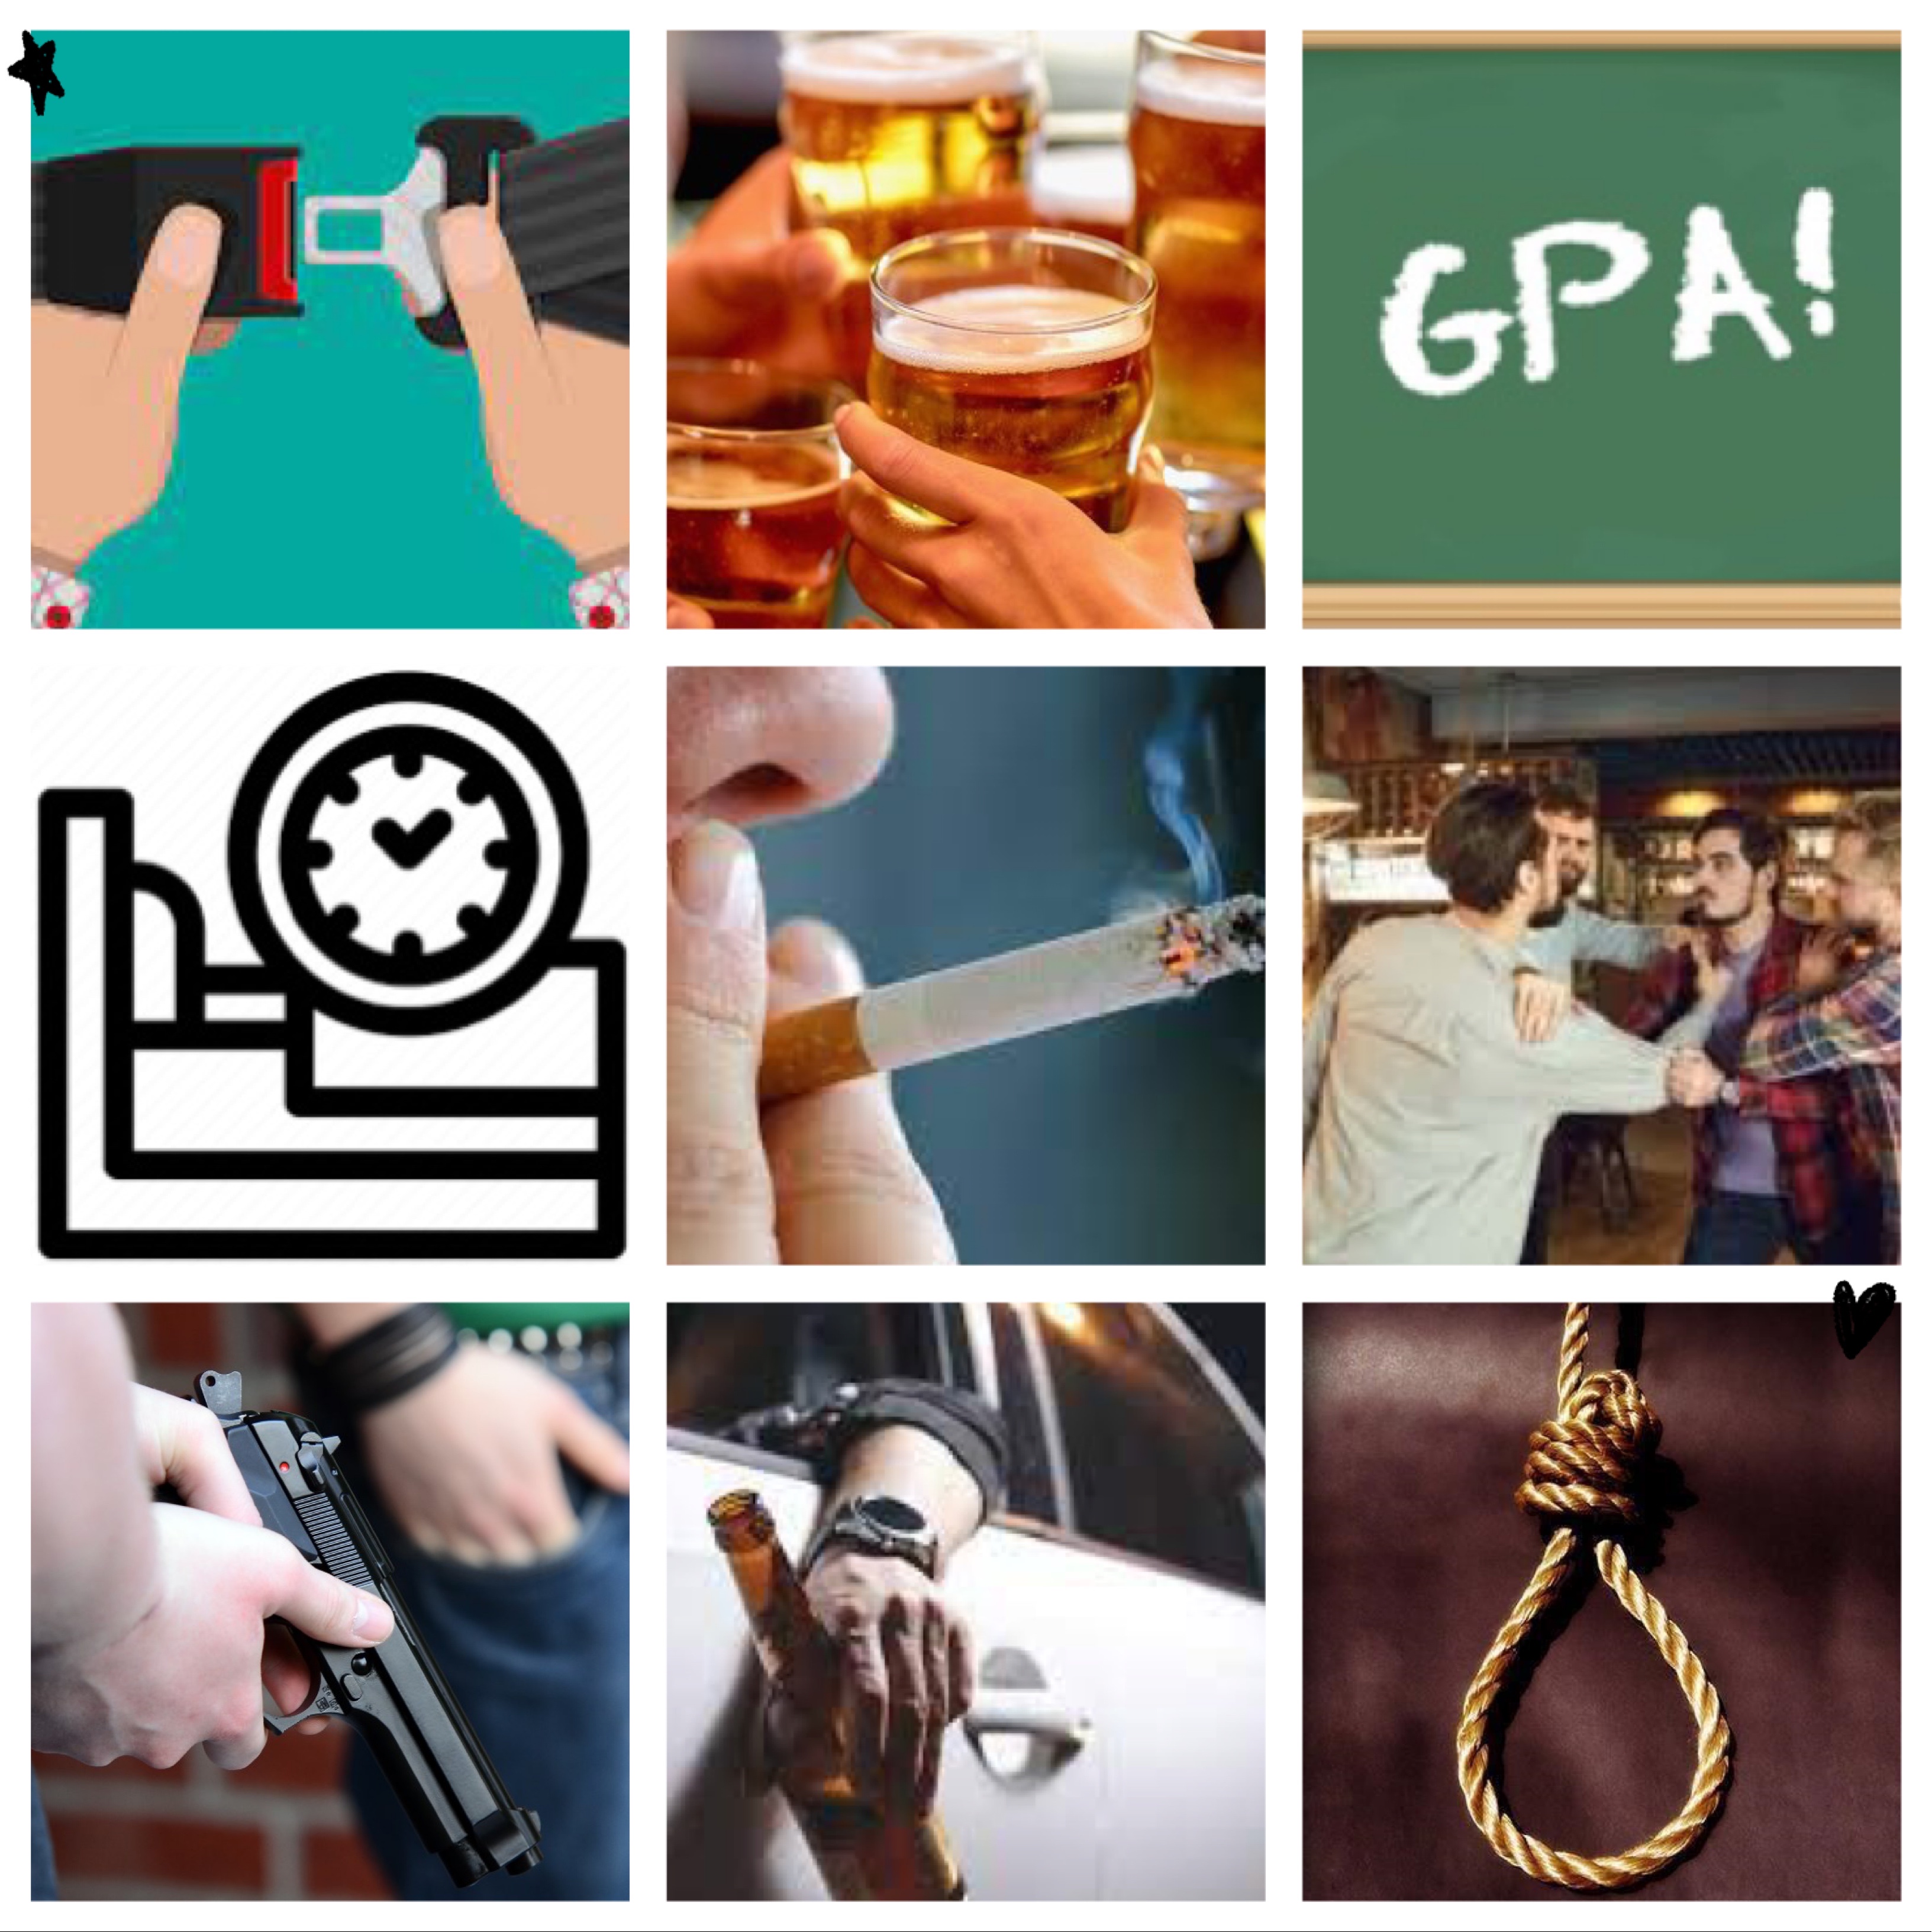
Multi-level Risky Behaviors
As for multi-level risky behaviors, we focus on smoking status, binge drinking, seat belt use and grades in school (GPA), and examine the relationship between drug use status and those risky factors separately. Also, we identify the association across grade, gender and race. We conclude that there is a significant effect of smoking status and binge drinking on drug use status, which means the association between drug use and those risky behaviors is very strong. Students with heavy dose usage tend to smoke more and have more binge drinking compared to students with no drug usage and light dose usage, which indicates that smoking and drinking are common among students who use drugs. 9th grade students have higher portions of heavy smokers and heavy binge drinking than other grades. Also, male have higher portions of heavy smokers and heavy binge drinking than female. Black or African American has a relatively weak association between drug use and both smoking and binge drinking. As for seat belt use, students who have fewer drugs wear seat belt more often. Therefore, students with no drug use have the highest safety awareness compare to students who have drug. Also, such students also tend to do better in school performance than those who use drugs, since the proportion of mostly A’s in GPA is very high in students who do not take drug.
Continuous Variables
For subjects who started to smoke from 9 to 12 years old, higher portions are heavy dose drug use subjects. Also, higher percentages of subjects who started to drink alcohol from 8 to 12 years old are heavy dose drug use subjects. There is an association between smoking and alcohol starting age and drug use frequency. It also implies that heavy dose subjects tend to smoke and drink alcohol much earlier than light dose drug use subjects and no drug use subjects. Based on boxplot and ANOVA test, there is no significant difference of BMI among three drug use frequency groups.
The health condition of students represents the future of the country. Although we could not make any causative conclusion, the presence of strong correlations should be the urgent call for more further studies and policies about on drug use among youth. The dose-response relationship between the drug use and these behaviors further validates the existence of the association and it might imply a causative effect of drug use on the incidence of risky behaviors.